  
Watershed Report
North-East NYS With the Flow
Report for the Week of June 5 to June 11, 2023
Low flows continue
Approximately four hundred thousand people reside in the New York's north and northeast watersheds, where run-off from rain and snow melt flows northeast to Lake Champlain or generally north to the St. Lawrence River, a transboundary waterway shared with Canada. Incidents and factors impacting water in this drainage basin can impact local drinking water supplies with downstream effects felt in parts of the New England states as well as parts of Ontario, Quebec and the Maritime provinces of Canada.
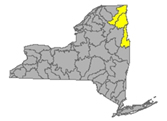
Find your location in one of the six watersheds of the central drainage basin
|
North - East NY Drainage Area
|
Low Flows
|
Impaired
Water
Bodies 303d list
|
Boil Water Advisories
|
HABs
|
Hazardous
Spills
|
|
Lake Champlain
|
6
|
29
|
0
|
0
|
4
|
|
St Lawrence River
|
4
|
41
|
0
|
0
|
1
|
|
Totals
|
10
|
70
|
0
|
0
|
5
|
Table updated June 12, 2023
Find your location in the areas draining toward the St. Lawrence River and Lake Champlain. Water related events occurring in this part of the state can impact downstream drinking water supplies for local residents and contaminants of concern can move further downstream to impact parts of the New England states and Eastern Canada.
Lake Champlain Watershed
 The Lake Champlain Watershed drains the area between the Adirondack Mountains in northeastern New York State and the Green Mountains in northwestern Vermont, includes the Ausable River, Saranac River, Great Chazy River, Boquet River, Mettawee River, Ticonderoga Creek/Lake George, Lake George, Upper Saranac Lake, Lower Saranac Lake, Lake Placid, Lake Champlain.
Flows gather the runoff from parts of Washington, Essex, and Clinton Counties:
- Mettawee River drains an area of 167 sq miles of Washington County into Lake Champlain. Normal flow near Middle Granville is normally around 350 cfs and 4.3 feet deep (flood stage 7 ft)
- Boquet River drains an area of 207 sq miles of Essex County. Normal flow at Willsboro is around 2000 cfs and 5 ft deep
- Ausable River drains an area of 198 sq miles of Clinton County. Normal flow near Au Sable Forks is around 3200 cfs and 4 ft deep
- East Branch Ausable River drains an area of 198 sq miles in Essex County. Normal flow at Au Sable Forks is around 1800 cfs and 4 ft deep
- Little Ausable River near Valcour normal flow is 200 cfs and 2 ft deep
- Salmon River drains an area of 63 sq miles in Clinton County. Normal flow at South Plattsburgh is 250 cfs and 2.5 ft deep
- Saranac River drains an area of 608 sq miles. Normal flow at Plattsburgh is 2400 cfs and 5.5 ft deep (flood stage 9ft)
- Great Chazy River drains an area of 243 sq miles in Clinton County. Normal flow at Perry Mills is 1250 cfs and 4.5 ft deep, (flood stage 9ft)
- Little Chazy River drains an area of 50 sq miles in Clinton County. Normal flow near Chazy is 225 cfs and 2.5 feet deep.
normal flow updated 06-19-23
Low Flows (6) as of June 12 10:00 am EDT
Six USGS monitored rivers creeks or streams are flowing much below normal or low today, including:
Ausable River is flowing low at Au Sable Forks - down slightly overnight - running a depth of 1.42 ft at 252 cubic feet per second
- East Branch Ausable River is flowing much below normal at Au Sable Forks - down overnight - running a depth of 1.28 ft at 85.7 cubic feet per second
- Mettawee River is flowing low near Middle Granville - down overnight - running 3.3 ft deep at 52.9 cubic feet per second
- Saranac River is flowing below normal at Plattsburg - running 3.2 ft deep at 444 cubic feet per second
- Great Chazy River is flowing below normal at Perry Mills - running 1.84 ft deep at 79.8 cubic feet per second
- Little Chazy River is flowing below normal near Chazy - running 1.9 ft deep at 13.9 cubic feet per second
Impaired Water Bodies (29)
29 water bodies appear on the 2022 Draft 303(d) list for Lake Champlain Watershed up from 6 in the last list. Of the 29 total, 12 water bodies are proposed for delisting, in whole or in part.
For more details, check out the posted list under the NE tab.
Drinking Water Advisories (0)
HABs (0)
Spills (4)
- June 5 - unknown amount of sulfur reported spilled at a commercial location on Paper Mill Glens Falls in South Glens Falls – Saratoga
- June 7 - 35 gallons of drilling mud reported spilled due to equipment failure on the NY-22 in Whitehall - Washington - Lake Champlain affected *
- June 8 - unknown amount of hydraulic oil reported spilled due to equipment failure at the Town Highway Department on State Route 30 in Saranac Lake – Franklin
- June 9 - unknown amount of diesel reported spilled from a Mobile Gas Station on State Route 9 in Lake George – Warren
St. Lawrence River Watershed
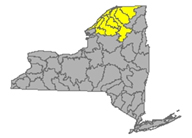 185 km of the St. Lawrence River catches the runoff from the northern and western Adirondack Mountains, drawing from portions of eight states, a combined area of 5600 square miles.
St. Lawrence Watershed collects the flow from eleven thousand miles of freshwater rivers and streams, including the Oswegatchie River, Raquette River, Saint Regis River, Grass River and Indian River; including Black Lake, Cranberry Lake, Raquette Lake, Tupper Lake and Long Lake. Densely forested woodlands, peatlands and areas of flat agricultural plains make up the natural surface water filtration system of this watershed area.
Flows: parts of St. Lawrence and Franklin Counties
Raquette River drains 1125 sq miles of St. Lawrence County. The flow
- at Piercefield normal flow is less than 1500 cfs and 6.4 ft deep (flood stage 12.5 ft)
- at South Colton, normal is around 2000 cfs and 5 feet deep (flood stage is 10ft)
- at Raymondville the normal flow is around 2500 cfs and 3.5 ft deep (updated 04-07-23)
St. Regis River drains an area of 612 sq miles in St. Lawrence County. The normal flow at Brasher Centre is less than 3000 cfs and 6 ft deep (flood stage 11ft)
West Branch St. Regis River drains an area of 171 sq miles in St. Lawrence County. Normal flow near Parishville is around 500 cfs and 2 ft deep
Little Salmon River drains an area of 92 sq miles of Franklin County. The normal flow at Bombay is 300 cfs and 3 ft deep.
Grass River drains an area of 598 sq miles in Franklin County. The flow at Chase Mills is unrated, we have seen this at 3000 cfs and 5.8 ft in spring
Oswegatchie River drains an area of 986 sq miles in St. Lawrence County. Normal flows
- near Oswegatchie under 900 cfs and 3.5 ft deep
- near Heuvelton normal flow is around 900 cfs and 2 ft deep
West Branch Oswegatchie River drains an area of 258 sq miles in St. Lawrence County. Normal flow near Harrisville is around 450 cfs and 3 ft deep. (updated 06-19-23)
Low Flows (4) June 12 10:00 am EDT
Little Salmon River is flowing low at Bombay - up slightly overnight at 2.24 ft deep and 25 cubic feet per second
Raquette River is flowing
- low at South Colton - up slightly overnight - running 1.95 ft deep and 66.3 cubic feet per second
- low at Raymondville - flow depth is 1.7 ft deep and 416 cubic feet per second
- low at Piercefield - down considerably overnight - flow depth is 3.75 ft deep and 396 cubic feet per second
West Branch St. Regis River is flowing much below normal near Parishville - flow depth is 1.3 ft deep and 117 cubic feet per second
St. Regis River is flowing much below normal at Brasher Center - flow depth is 6.07 ft deep and 340 cubic feet per second
Impaired Water Bodies (41)
41 water bodies appear on the 2022 Draft 303(d) list for St. Lawrence Watershed, up from 4 in the last list. Of the 41 total, 5 are proposed for delisting, in whole or in part.
For more details, check out the posted list under the NE tab.
Drinking Water Advisories (0)
HABs (0)
Spills (1)
- June 5 - unknown amount of hydraulic oil reported spilled due to equipment failure on Route 22 in Whitehall - Washington
Report Key
Flows
WTNY describes the stream flows in each of 17 watersheds, including direction/path of flow, listing monitoring stations in order from headwaters to outlet, indicating the normal flow volume in cubic feet per second (CFS), the gage height (flow depth) during normal conditions and the flood stages, or the gage height at which flooding will occur. Locate your “home body” (the river or stream nearest you) to see where the flow originates, how high the flow must be for minor flooding to occur. Log in to USGS Waterwatch current streamflow for real time measurements at the monitoring station nearest you and sign up there for high flow alerts.
Flow volume can change rapidly during snowmelt and rain events, check your local upstream station flow levels at the USGS WaterWatch Current Streamflow site, or sign up for high flow alerts to your mobile device. Streamflow data is subject to review as sensors at the monitoring stations do malfunction from time to time. See USGS Provisional Data Statement at the end of this report for more information.
EPA Impaired Water Bodies 303d List
The EPA requires all states update a draft list of impaired water bodies (the 303d list) every two years; providing a period for public comments, presenting the draft list to the EPA. The final 303d list is published as approved by the EPA, roughly every two years.
Impaired water bodies are defined as those with contaminants measured above threshold levels, as set by the EPA Clean Water Act, or where the desired use is impaired. The latest Draft List for New York State, covering 2020-2022 has closed for public comments, being submitted to EPA for review. (See the 2020-2022 Draft Impaired Water Bodies 303(d) List, organized by watershed area, here on this site.) The 2020-2022 Draft list includes NYS lakes, creeks, rivers and reservoirs that New York Department of Environmental Conservation has recommended for de-listing, along with water bodies requiring Total Maximum Daily Load (TMDL) plans. The TMDL plan is a type of Clean Water Plans, established by a collaboration of municipal, industrial and environmental groups in an overlay zoning district.
Hazardous Algae Blooms (HABs) Beach Alerts – monitoring is complete for the season, will resume in spring 2023
Hazardous algae blooms are reported here as they are confirmed across the state, as found on the NYS Department of Environmental Conservation NYHABs notification site.
- active blooms are reports current within two weeks, observed reported and confirmed. These are listed by water body with date and time of the report, placed in the applicable watershed, with location information (accuracy of our location description is limited by the accuracy of the location tag in the report to NY DEC).
Contact parks management for the current information on local conditions before heading out and consider using an on-site rapid test for microcystin toxin.
Drinking Water Advisories
Boil Water and Do not Consume advisories issued by drinking water facilities for various reasons, short term disruptions due to water main breaks, repairs, loss of pressure are posted here by watershed area. NYS and EPA Region 2 Drinking water facility notices are posted here.
Spills
NYS Spill Hotline: 1-800-457-7362
National Response Center: 1-800-424-8802
Reporting from the latest records uploaded to the NYS Hazardous Spill Incidents database by County each week.
- Spills of petroleum products of 40 gallons or more are listed weekly in the watershed in which they occur, citing location of the spill, the contaminant spilled (if known), the quantity (if known) and the resource affected (if known) surface water, groundwater, sewer, etc, and any amount recovered at the site.
Spills over 100 gal, very toxic chemical spills and spills that impact state waters are flagged and followed up with the spiller, the state and/or EPA authorities for more information, these are marked with asterisk.*
See NY Spills Tracker for more information on these spills as it becomes available.
Note: DEC receives upward of sixteen thousand spill reports each year; each report is investigated by qualified personnel. Report files are closed when it is determined the spill is contained and under the control of the spiller or state authorities and a clean up plan is in place or completed.
Sources
WaterToday New York aggregates information and data from New York State Department of Environmental Conservation, Department of Health, Region 2- EPA, USGS, NWS, NOAA by watershed area. The accuracy of the information contained in our reports is dependent on these sources. Provisional data statements apply, confirm data with local authorities before taking action.
|
All rights reserved 2026 - WTNY - This material may not be reproduced in whole or in part and may not be distributed,
publicly performed, proxy cached or otherwise used, except with express permission.
|
|
|
